Trade tracker for following each trade's results over time
A trade tracker is an app where you log each trade and follow its results over time. Astro Trading Journal is the app that keeps that record.
How a logged trade becomes a running record
- 1.
Record the trade
You enter the trade yourself: the symbol, the direction and the size. You record the size in the unit the market trades in, and the profit and loss is worked out from that position.
- 2.
Tag the setup
Add a setup tag for the idea you traded, such as the pattern or the plan you followed. Trades with the same tag are grouped together later.
- 3.
Close the trade
When the trade closes, Astro works out its P&L from the size you recorded. P&L is the money that trade made or lost.
- 4.
Add the result to the record
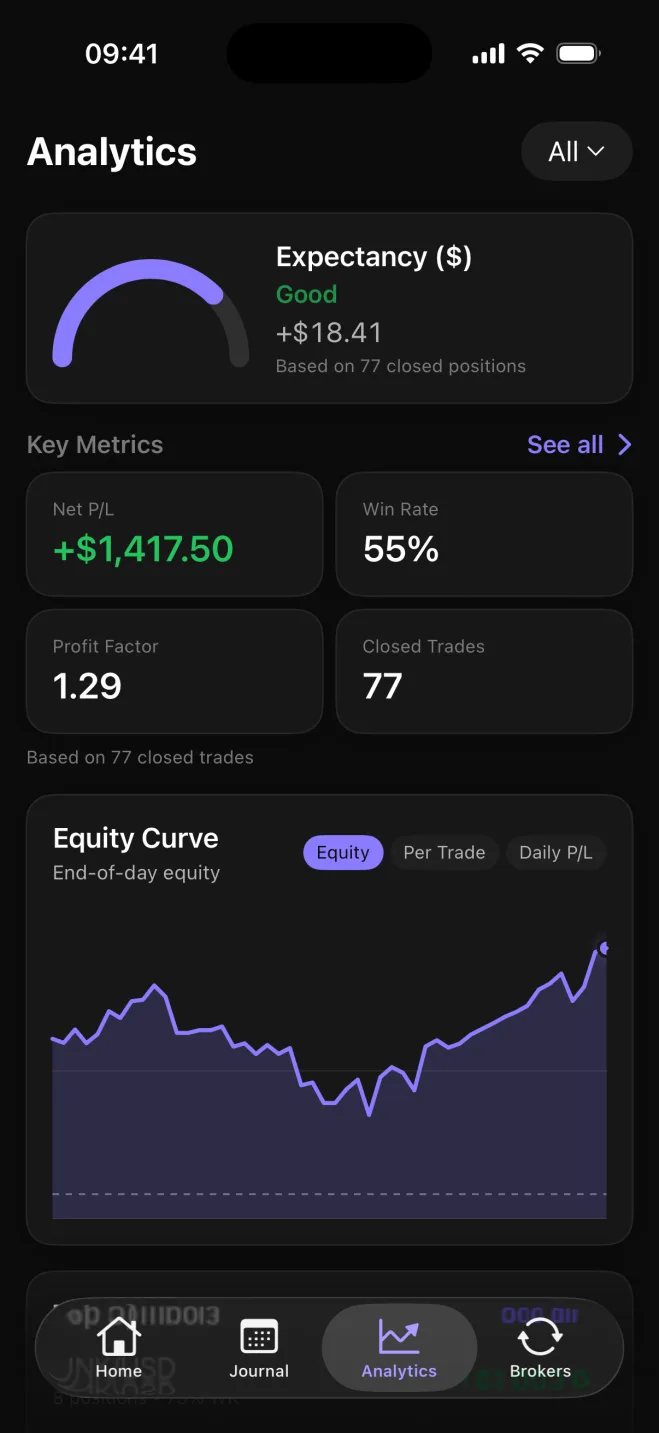
On the Analytics tab, the record of closed trades shows up as net P&L, win rate, average win against average loss, and an equity curve.
Win rate is the share of closed trades that made money. Average win is what a winning trade made on average, and average loss is what a losing trade lost on average. The equity curve is the running line of closed-trade results over time.
The Analytics tab pictured here shows expectancy of +$18.41, net P/L of +$1,417.50, a 55% win rate and a profit factor of 1.29 over 77 closed trades, with the equity curve under those figures. Expectancy on that screen is the average result per closed trade. Profit factor compares the money won on winning trades with the money lost on losing trades.
Which trades keep paying
The same closed trades then break down by symbol, asset class, direction, setup and playbook, which is how you tell which trades keep paying.
Direction separates long trades from short trades. Longs are trades that benefit if price rises. Shorts benefit if it falls. Symbol and asset class do the same job for markets, so you can see which names and which kinds of market are adding to net P&L.
The setup tag you added on the trade names the idea behind it. Setups group into named playbooks, and those playbooks can be compared side by side. The comparison shows which tagged idea has the stronger net P&L and win rate in your own record.
Analytics also shows gross P&L beside net P&L. Gross P&L is the closed-trade result before costs, and net P&L is the result after those costs. Drawdown appears once you set a starting balance, and it is how far the record fell from a high point to a later low.
How stocks, forex and the other markets are sized
Astro is an iPhone app and a full web app on one account. A trade added on one shows up on the other, and both work out the same metrics by the same rules, so the numbers match.
How each market is sized
- Forex is recorded in lots, with the contract size that matches the symbol.
- Stocks are recorded in shares.
- Futures are recorded in contracts, valued by tick value and tick size, or by a value you set per move.
- Crypto is recorded in units, including fractional sizes.
- Stock CFDs and futures CFDs are recorded by contract size, and a futures CFD stays separate from an exchange-traded futures contract.
Forex, stocks, futures, crypto and CFDs can share that one journal. Each trade keeps the currency it settles in. A reporting currency rolls those totals up across trades that settle differently.