Stock journal: log each stock trade and see which tickers, longs, shorts and setups pay
A stock journal keeps a record of every stock trade you take, with results you can read by ticker, by direction, and by setup. Astro Trading Journal is a free stock journal with no trade cap, on iPhone and on the web. 1
What to write down for each stock trade
Each trade is one entry in Astro. You give it the ticker and mark it long or short. Then come the entry and exit prices, the number of shares, and a setup tag: the name of the pattern or plan behind the trade, such as a breakout or a pullback.
What one stock trade records
- Ticker
- Long or short
- Entry price
- Exit price
- Size in shares
- Setup tag, such as breakout or pullback
- A reflection: why you took it and how you felt
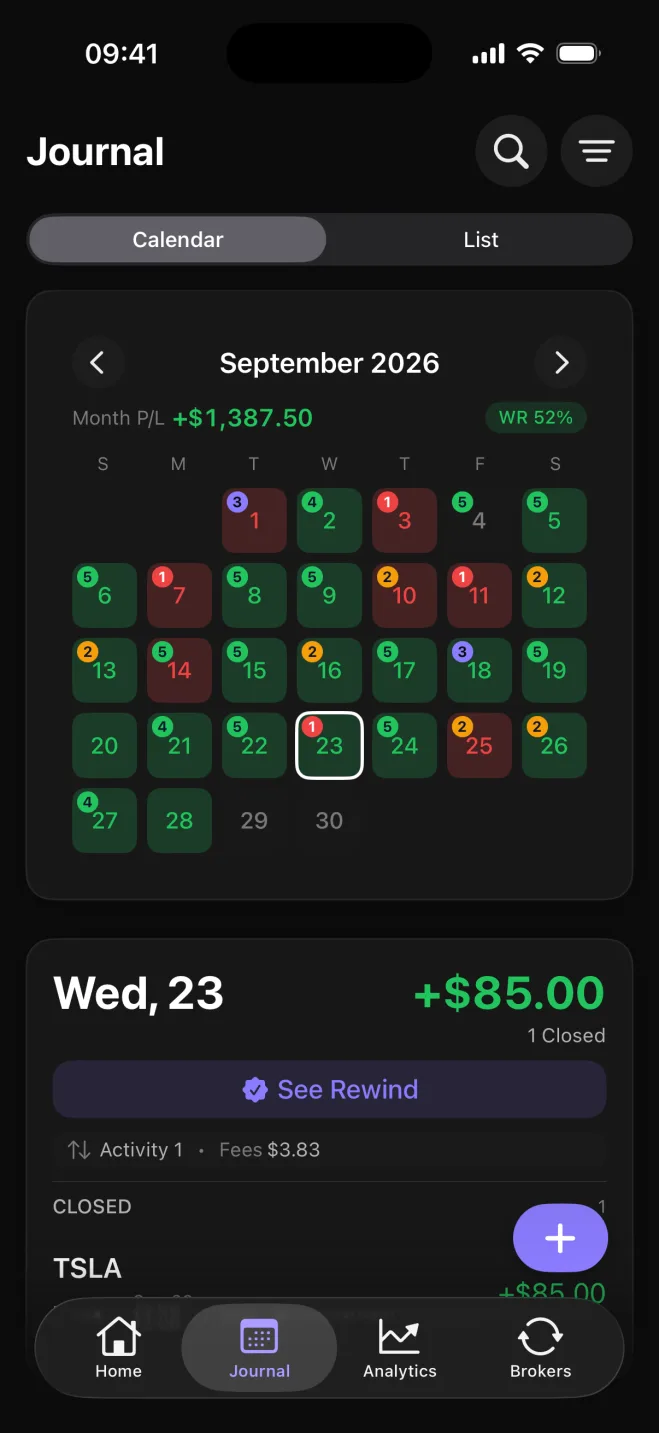
Each trade keeps its own currency, which matters when some of your tickers trade in dollars and others in euros or pounds. In the Journal tab, a calendar shows each day's P&L with the trades closed on it, so you can go back through a week of trades day by day.
A trade can also get a reflection. You tag what drove it from a list of 18 influences. Behavior influences include "followed plan", "FOMO", "revenge", "rushed", "hesitated" and "overtraded". Mindset influences include "calm", "focused", "anxious", "frustrated", "overconfident" and "tired". "Revenge" marks a trade taken right after a loss to win the money back, and "followed plan" marks a trade you entered and managed the way your plan said, whatever the result.
Results by ticker, direction and setup
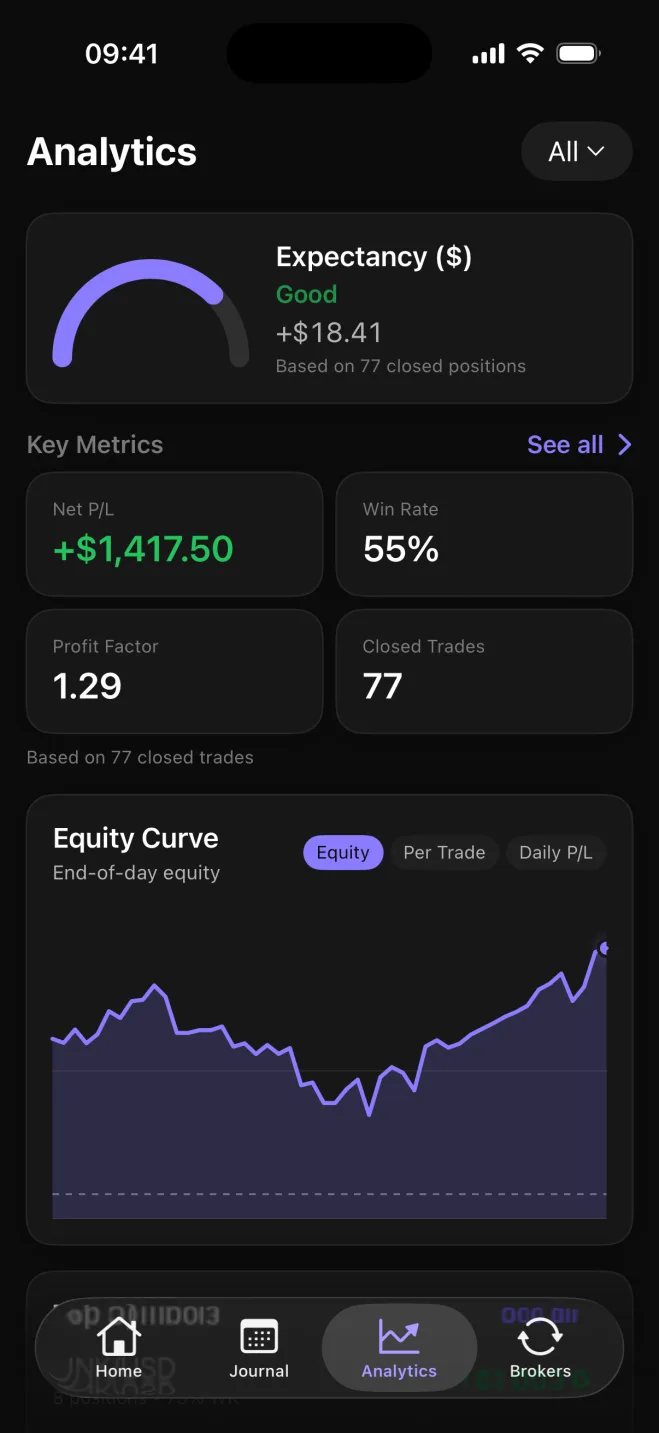
The Analytics tab breaks your trades down by symbol, by direction and by setup. Each line shows net P&L, win rate (the share of closed trades that ended in profit) and average win vs. average loss. Across the whole account you get those same figures, plus gross P&L. Set a starting balance and it also tracks drawdown, how far the account has fallen from its peak.
On the symbol breakdown, every ticker gets its own line. A name that has lost money across a run of trades is hard to miss there, and you can stop trading it or cut the size. Sometimes the surprise runs the other way, and most of the month's result turns out to have come from a ticker you barely thought about.
The direction breakdown puts the longs and the shorts side by side. If the shorts give back part of what the longs earn, the two lines show it, and the decision is whether to stop shorting or to short only in the setups where it has paid.
Setups can be grouped into named playbooks and compared side by side. A pullback playbook and a breakout playbook each show their own results, so you can see which one is paying and which one is flat.
Astro ranks the influences that come up most, with the net P&L and win rate behind each, so you can see whether the trades tagged "FOMO" or "revenge" are the ones costing money, and what the trades tagged "followed plan" returned.
Below is the account-wide overview, which adds the equity curve and two more figures. Expectancy is what the average trade has made or lost, and profit factor is gross wins divided by gross losses, both worked out over every closed trade.
What's free, and where a notebook or Excel falls short
The free plan is the whole journal with no trade cap: manual entry, the analytics by ticker, direction and setup, setups and playbooks, reflections, Daily Rewind and notes, on iPhone and on the web. Every account also gets one free AI Review. Premium adds broker and exchange sync and unlimited AI Reviews.1
Daily Rewind is the end-of-day check-in: you go through the day's closed trades that have no reflection yet, rate from 1 to 5 how well you followed your plan, and mark each of your own rules as followed, partly followed, or broken. Notes is where you write about the trades, with a rich-text editor and images placed right in the note, so a weekly review or your market prep can include the chart it refers to.
A notebook holds the same facts, but the numbers by ticker, long vs. short, and setup are yours to work out, and they get out of date if you stop adding them up. An Excel template gives you totals as long as you keep its formulas alive, and the reason and the feeling behind each row end up in a comments column, if anywhere. In Astro those breakdowns are there as soon as the trade is logged, and the reflection is part of the entry.
iPhone and web share one account. Log the trade on the phone after the close and read the breakdowns on a bigger screen on the weekend.
Sources
- 1.Astro Trading Journal, “Astro Trading Journal pricing,” tradingastro.com