Trading log: keep a free record of every trade you take
A trading log is the record of each trade you take: the date, symbol, direction, entry, exit, size and result, written down so you can read it back later and see what worked. Astro Trading Journal keeps that log for free, with no cap on the number of trades, on iPhone and on the web.
What goes in a trading log
Each trade is one record with the same fields every time, so you can still read the log months later.
The fields of one trade record
- Date: the day you took the trade.
- Symbol: what you traded, such as EURUSD, TSLA or BTC.
- Direction: long or short.
- Entry: the price you got in at.
- Exit: the price you got out at.
- Size: how much you traded, in the unit your market uses: lots, shares, contracts or units.
- P&L: the profit or loss on the trade, worked out from entry, exit and size.
- Setup: the pattern or reason you took the trade, kept as a tag you can group results by later.
- Influences: what shaped the trade, picked from a list of behaviors and states of mind.
- Notes: anything else worth remembering about the trade.
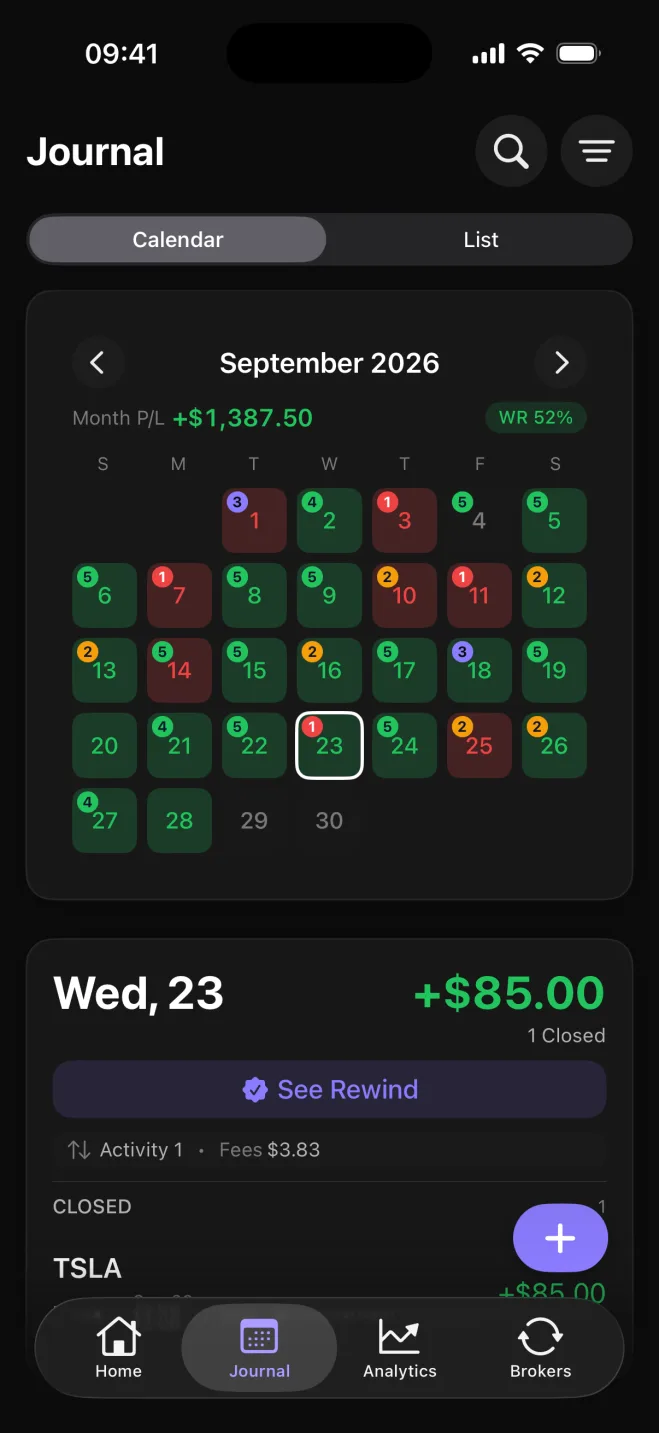
In Astro the log is the calendar in the Journal tab: each day is colored by its P&L and shows how many trades you took, and a day opens to the trades taken on it, each with this full record.
Influences are the field most templates leave out. The list of 18 includes behaviors such as followed plan, revenge or FOMO, and states of mind such as calm, anxious or overconfident. You pick the ones that applied when you log the trade.
A trading log and a trading journal are nearly the same thing. The log is the plain record of each trade. A journal is that record plus the habit of reading it back and reflecting on it. In Astro you write the reflection on the trade itself, so the record you open later holds both the result and what you thought. Longer writing, such as a weekly review, goes in Notes, a rich-text space beside the log that takes images, including the chart behind a trade.
A free trading log, with no template to build
Astro's free plan includes the full trading log: manual entry, analytics, setups and playbooks, trade reflections, Daily Rewind (an end-of-day check-in on the day's trades) and notes.
A spreadsheet template does the same job only after you build it, with a row per trade, a P&L formula and a pivot table for results, and you have to maintain it every time you add a market or change a column. Astro comes with the fields, the P&L calculations and the result breakdowns already built, so there is nothing to set up before the first trade goes in.
Premium adds two things: broker and exchange sync, so trades arrive in the log on their own, and unlimited AI Reviews. Every account gets one AI Review free. It is a short written review of the trades in your log.
How position size and P&L work in each market
Every market counts size differently, so the P&L formula has to change with it. Astro records size in the unit each market trades in and works out P&L from that unit.
| Market | Size unit | How P&L is calculated |
|---|---|---|
| Forex | Lots | The price move multiplied by the lots and the symbol's contract size |
| Stocks | Shares | The price move multiplied by the number of shares |
| Futures | Contracts | The point move multiplied by the point value and the number of contracts |
| Crypto | Units, fractional sizes included | The price move multiplied by the number of units |
| Stock and futures CFDs | Contracts | The price move multiplied by the contract size |
Each trade keeps its own currency, and a reporting currency rolls the totals up, so a EURUSD trade and a TSLA trade can sit in the same week and the week's P&L still adds up.
Reviewing your log to see what worked
Astro's analytics show net and gross P&L, win rate, average win against average loss, and drawdown. Win rate is the share of trades that closed in profit. Drawdown is the largest fall from a peak in your balance, and it appears once you set a starting balance.
Each figure breaks down by symbol, asset class, direction, setup and playbook. Long and short results on the same symbol are split out. The setup rows show which pattern makes money, and the symbol rows show which markets you'd be better off dropping. You can group those setups into named playbooks and compare the playbooks side by side.
Influences get the same treatment. Astro ranks the ones you picked most often, with the net P&L and win rate behind each, so you can see what revenge trades or FOMO entries have cost.
Log on your phone, read it back on your computer
The iPhone app and the full web app share one Astro account. A trade, note or reflection added on the phone shows up on the web, and the other way round.1,2
Log the trade on the phone right after it closes, while you still remember what drove it, and review the week on a big screen with the breakdowns side by side.
Sources
- 1.Apple App Store, “Trading Journal: Astro Trade on the App Store,” apps.apple.com
- 2.Astro Trading Journal, “Astro Trading Journal web app,” app.tradingastro.com